Reset ustawień
 Kontrast
 Widok
Widok Czytelność
 Czcionka
 Znaki
Znaki Interlinia
 Słowa
Słowa Akapity
 Deklaracja dostępności


Mapping the future of Green Hydrogen
 Mapping the Future of Green Hydrogen: Integrated Analysis of Poland and the EU’s Development Pathways to 2050.
Energies 2023, 16, 6261. https://doi.org/10.3390/en16176261
Selected results of the report
This analysis calculations were conducted to assess the potential for “green hydrogen” production in Poland and the EU+ under four different scenarios. These scenarios vary in the scale of availability of specific technologies crucial for emission reduction in the energy sector. While all scenarios aim the achieve climate neutrality by 2050, they differ in the approaches taken to achieve this goal:
1️⃣ The EU Climate Neutrality Scenario (fit) The EU Climate Neutrality
2️⃣ Scenario with low CCS utilization in the EU+ (low_ccs)
3️⃣ The EU Climate Neutrality Scenario without new nuclear power plant in the EU+ (no_nuc)
4️⃣ The EU Climate Neutrality Scenario with higher amount of “green hydrogen” available in the EU+ (hi_hyd)
All scenarios, both for Poland and EU+, are characterized by a high share of RES in the generation mix. This is an important factor for “green hydrogen” production because for best cost effectiveness hydrogen should be generated from surplus RES production.
Most of the hydrogen produced through electrolysis method is consumed by other sectors, but part is used in gas turbines for electricity generation (and in some cases district heating). The broader use of this fuel in energy sector is limited by the capacity of electrolyzers and the relatively high cost of electricity generation using this method. These systems can operate using natural gas or hydrogen and are primarily used for peak demand. When operating on hydrogen, it acts as a long-term energy storage and ensures system flexibility. The subsidy level adopted in the hi_hyd scenario was sufficient to increase hydrogen consumption in other sectors, but still insufficient to encourage the use of hydrogen in the energy sector.
An important precondition for increasing the share of hydrogen in the Polish energy mix is the implementation of the nuclear power development program. Nuclear power plants, operating in the load base, will cause that some considerable amount of surplus energy from RES should appear for producing the “green hydrogen”. In the scenario with constraints on the construction of new nuclear power plants in Europe, including Poland (no_nuc), there are strong limitations on the development of “green hydrogen” production. This is one of the main conclusions from comparisons of the no_nuc scenario with the other scenarios.
In the fit scenario, hydrogen production in 2050 is slightly above 5 000 PJ in EU+ and less than 200 PJ in Poland. In Poland about 35% of hydrogen is used in power generation and 65% in other sectors. At the level of the entire EU+, the share of hydrogen production for energy applications is slightly lower (25%). In the fit scenario, the model makes maximum use of the available electrolyzer potential.
The low_ccs scenario shows lower final demand for hydrogen, but the share of hydrogen consumption in the power sector is higher than in the fit scenario, probably due to the high emission allowances prices and the urgent need to replace natural gas with hydrogen in this sector.
The result for the no_nuc scenario indicates significantly lower hydrogen consumption both in energy sector and final demand. In the case of Poland, this effect is even stronger because hydrogen is not used at all for the production of electricity and heat – only the demand from other sectors is satisfied, significantly reduced due to the higher cost of hydrogen. This confirms that the nuclear power is important in the context of the development of the hydrogen economy. In the situation of limited potential of RES, nuclear power plants allow for greater green electricity surpluses, which affects the availability and price of “green hydrogen”.
In the MEESA model, hydrogen production is exclusively based on electricity from RES (“green hydrogen”). Electricity from RES can be transferred directly to the grid or used for hydrogen production – model does not include RES technologies that generate electricity solely for the electrolyzers. Therefore, the cost is influenced not only by costs associated with RES but also by the prevailing electricity prices in the system at a given moment. Consequently, the marginal cost of hydrogen depends on many factors, such as the level and structure of demand for electricity, the availability of different technologies, the potential of RES and many other.
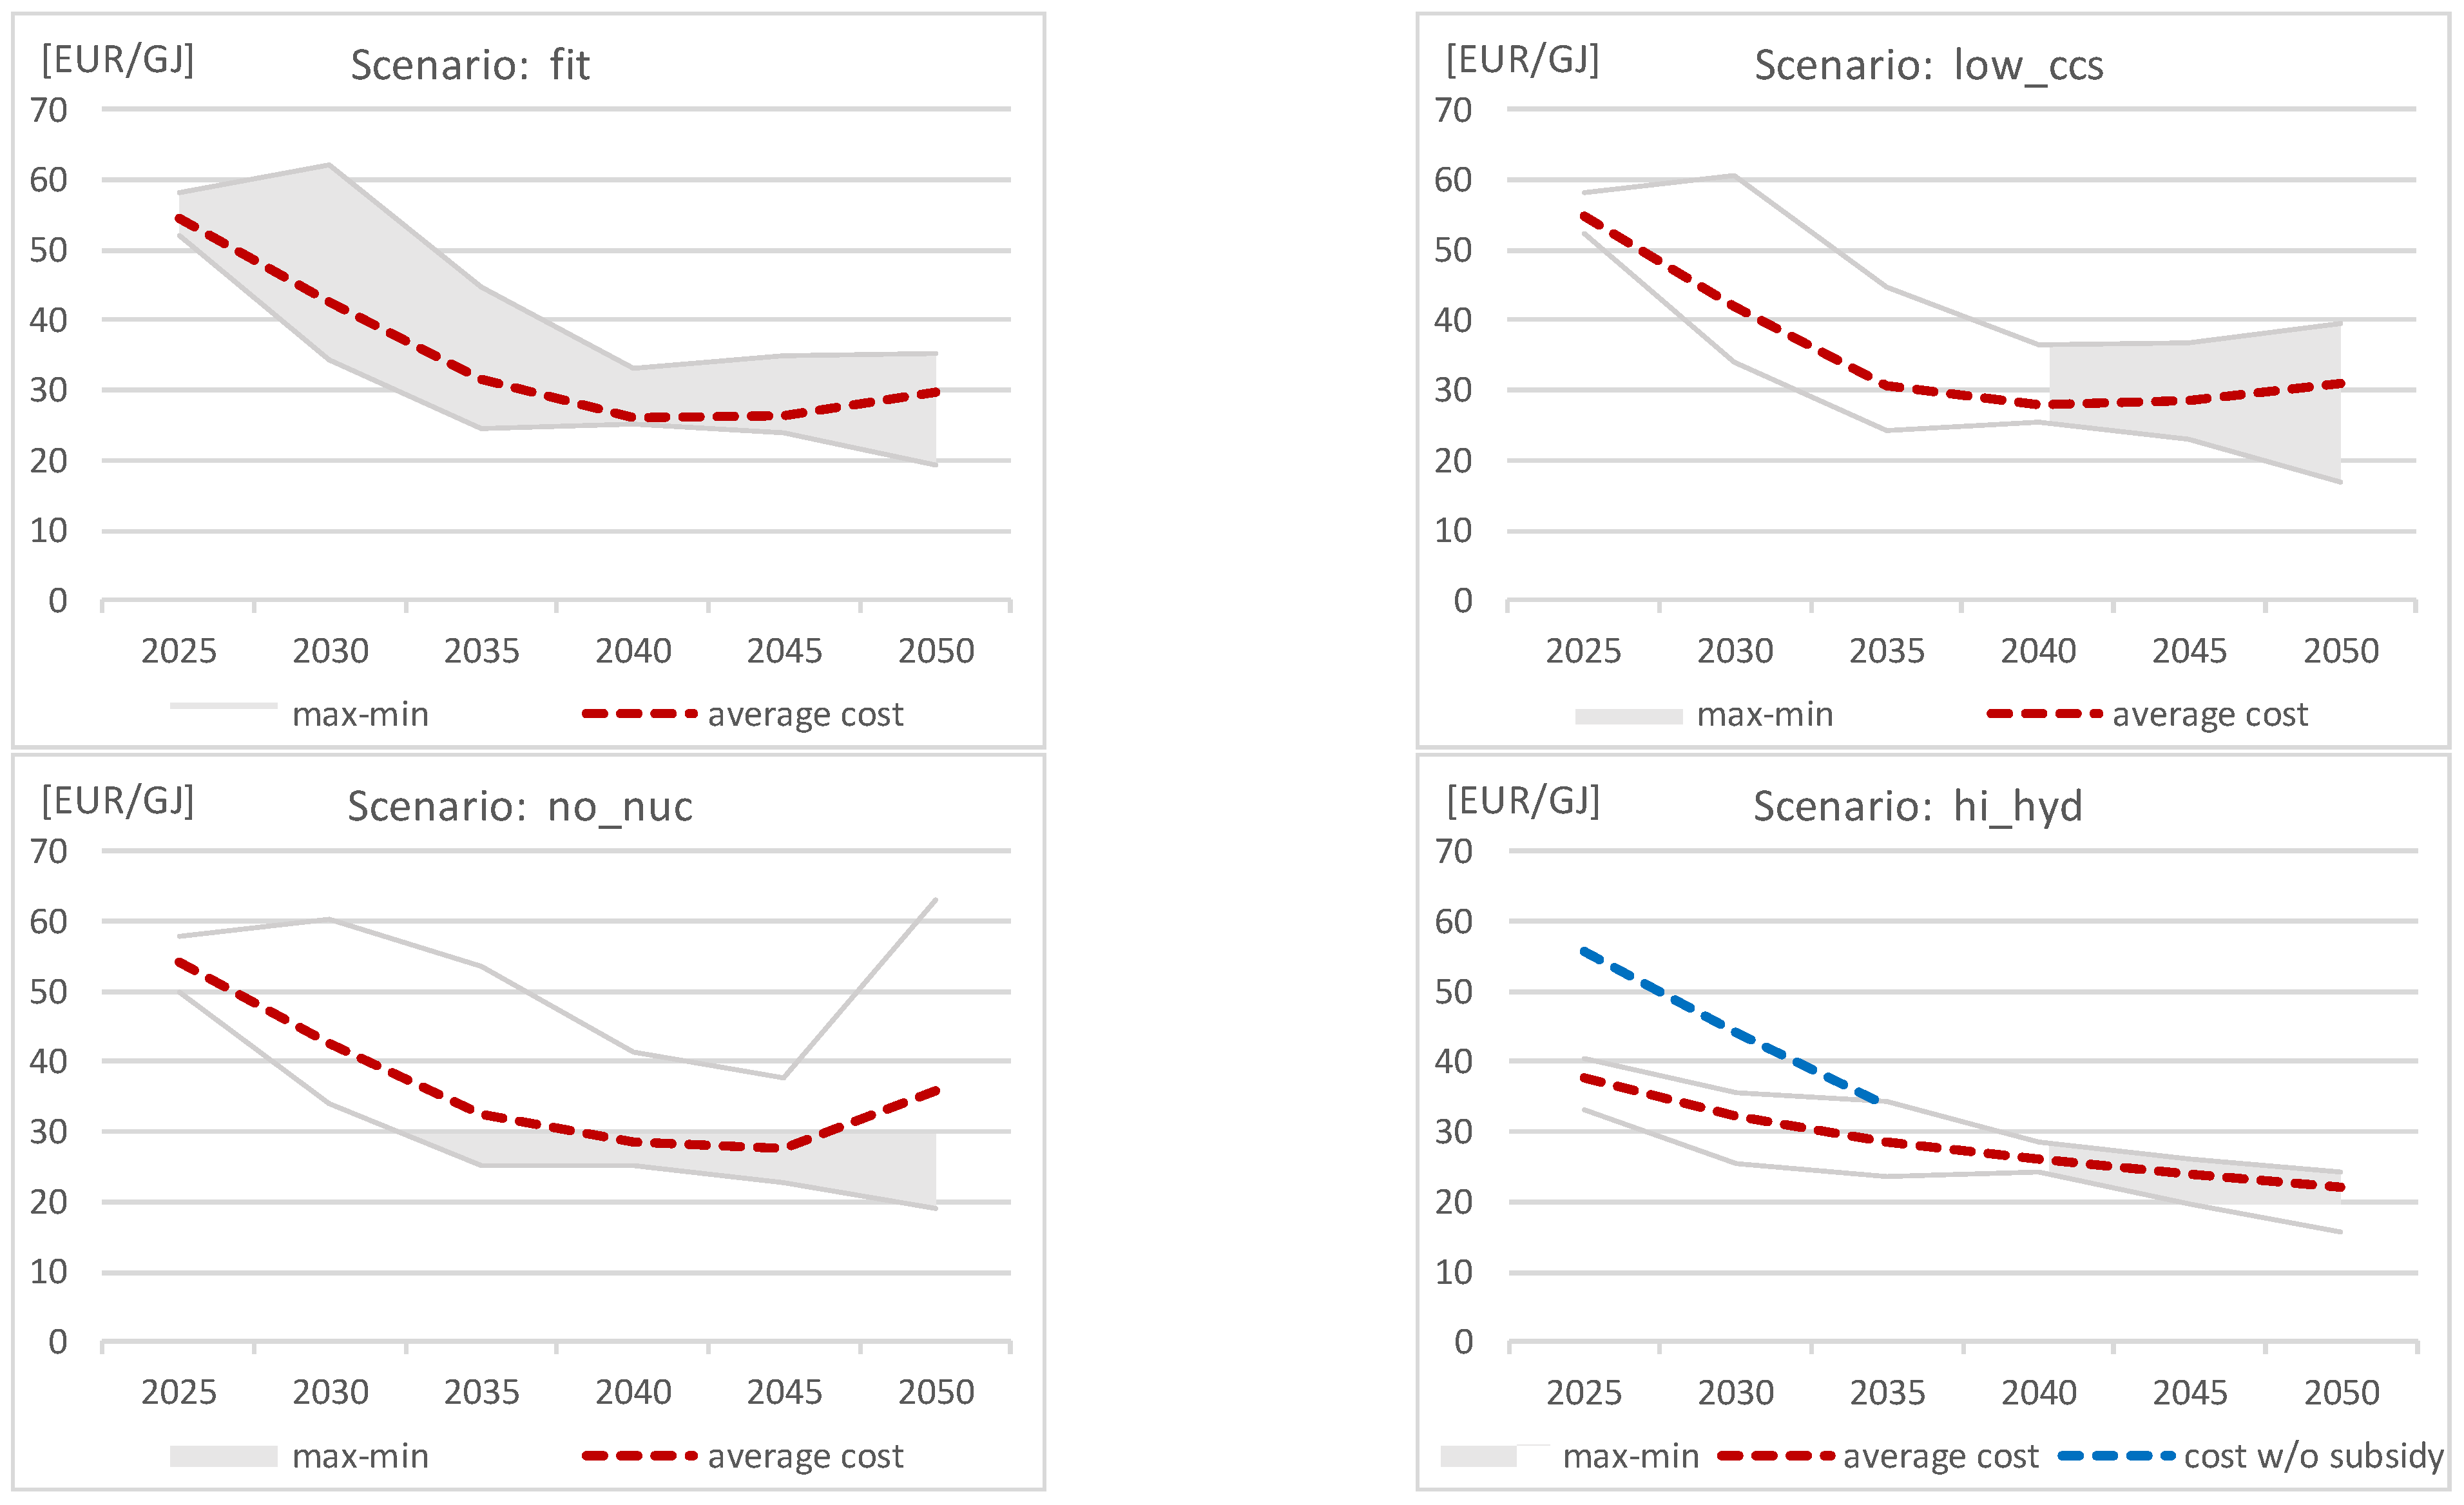
Fig. 12. shows the marginal cost of hydrogen production for different scenarios. The gray area shows the range of costs in the EU regions – between the maximum and minimum cost, while the red dotted line shows an average cost.
Source: Model MEESA
Figure 12. “Green hydrogen” marginal cost in the EU+ for 2025-2050 in different scenarios [EUR/GJ].
In all scenarios the initial average marginal cost of “green hydrogen” is around 55 EUR/GJ. The EU+ wide average cost drops below 30 EUR/GJ in 2040. In the fit, low_ccs and no_nuc scenarios, the average marginal cost increases again after 2045, due to the limited development potential of electrolyzers. Only in the hi_hyd scenario, with this potential significantly higher, the costs continue to decrease slowly after 2045. Figure for hi_hyd scenario shows also difference between an average cost with (red line) and without subsidizing hydrogen (blue line).
There are also interesting differences between marginal hydrogen costs in specific regions. In all scenarios, the highest hydrogen costs in 2025-2040 are found in Poland, which is caused mainly by high electricity cost driven by high carbon prices and still high share of fossil fuels in the Polish energy mix. Especially the no_nuc scenario is unfavorable for Poland, where hydrogen cost exceeds 60 EUR/GJ in 2050. In contrast, the lowest costs occur in the Northern Region, composed of the Nordic countries and the Baltic states, thanks to large RES potential. The most stable situation, with low hydrogen costs and the smallest differences between individual EU regions, occurs in the hi_hyd scenario.
The results indicate that the regions with a combination of significant potential for intermittent renewable energy sources and stable zero-emission baseload electricity production, such as large hydro or nuclear power plants, tend to have lower hydrogen production costs. This is because the unstable renewables can provide the necessary electricity for electrolysis during periods of high renewable energy generation, while the baseload sources ensure a continuous and stable electricity supply. By leveraging these characteristics, regions can optimize their hydrogen production processes and achieve cost efficiencies.
The highest volumes of hydrogen production were obtained in the hi_hyd scenario, which is reasonable given that this scenario assumed a higher potential for electrolyzer expansion. Nevertheless the model did not rely on the maximum values of the assumed potential. This is an important observation, because it shows that the large development of electrolyzers might be also limited by other factors determining its cost effectiveness. Availability of surplus RES production, shape of the demand curve, the scale of development of battery storage and even the share of electric cars will also affect the use of hydrogen in the energy sector.
Conclusions
This paper focuses on the potential of the “green hydrogen” production in Poland and the EU+ considering the assumptions outlined in the “Fit for 55” package. The scale of this potential is closely linked to the level of hydrogen demand in various sectors including, industrial, transportation and energy. The level of demand, in turn, is driven by the need to replace fossil fuel-based technologies with zero-emission technologies in order to meet EU greenhouse gas reduction targets.
- The potential for producing “green hydrogen” is correlated with the amount of surplus low-cost energy that can be utilized in electrolyzers. The greater the installed capacity of RES in the system, the larger the surplus energy available. The article estimates the size of the production of “green hydrogen” in Poland and in the EU+, reflecting the needs stemming from the 2050 reduction targets, and defines the role of hydrogen in the energy transition.
- The conducted analysis clearly show that achieving climate neutrality in the EU is very difficult without a significant role for hydrogen. A prerequisite for the development of this market segment is the existence of adequate amounts of cheap energy that can be used in the electrolysis process. Such energy can be generated in power systems characterized by a substantial share of RES sources and zero-emission base-load units, such as nuclear power plants.
- One key finding is that the largest share of hydrogen production will be associated with industrial and transportation. In the energy sector, the hydrogen will be used primarily as a long-term energy storage and a flexible source to contribute to load balancing. The relatively high costs of hydrogen utilization in the power sector compared to other technologies with similar functions in the system limit its adoption. However, after 2040, the projected significant decrease in the cost of producing “green hydrogen” from €50-60/GJ to €20-30/GJ is expected to drive increased utilization of hydrogen in the energy sector.
- The analysis also highlights that there is high demand, and therefore production needs for “green hydrogen” in the end-use sectors where available technologies do not enable zero greenhouse gas emissions. It is worth noting that the demand for hydrogen may be even higher than indicated in the analysis, if the development of the hydrogen market in these sectors is financially supported through various subsidies, which were not taken considered in the analytical work carried out for the purposes of this article.
If you want to know more about our Centre for Climate and Energy Analyses (CAKE) work we invite you to follow our webpage and social media channels on “X” @climate_cake and “LinkedIn”.
If you are interested in all the analysis we have made, please check out our analysis and reports which are available on our website: CAKE Reports
 VIIEW on EU ETS 2050: Changing the scope of the EU ETS (7.5 MiB, 2,074 hits)
- Poland net-zero 2050. Transformation of the Polish and EU Energy Sector until 2050. Summary. (1.1 MiB, 1,711 hits)
- Poland net-zero 2050. The Role of Public Transport in the context of the “Fit for 55” package to 2050. Summary. (763.9 KiB, 1,237 hits)
- “Poland net-zero 2050. The roadmap toward achievement of the EU climate policy goals in Poland by 2050. Summary.” (775.7 KiB, 2,513 hits)
Back